

Hardly anyone reckoned that struggling in high school to calculate the area of a triangle or the volume of a prism could be used one day to influence the outcome of an election. Geometry, however, can be a powerful tool in shaping results of an electoral contest—at least in plurality voting systems.
Designing a perfect election system for multiple parties is impossible, even with mathematical tools. But if, by and large, there are only two dominant parties, as in the U.S., things should be fairly clear-cut. The party candidate with the most votes wins, right? Anyone who has followed U.S. presidential elections in recent years knows that the reality is different. One important factor is the actual shape of the voting districts. If cleverly designed, a party that is actually losing can still gain the majority of representatives—an issue that was by no means absent in the U.S. midterm elections.
Math playsan important role in determining election outcomes, particularly for the 435 seats in the House of Representatives. By cleverly choosing the boundaries of a congressional district, a party can enable its candidate to win even if the vote count does not fairly represent the sentiment of the voters.
On supporting science journalism
If you’re enjoying this article, consider supporting our award-winning journalism by subscribing. By purchasing a subscription you are helping to ensure the future of impactful stories about the discoveries and ideas shaping our world today.
Here’s a highly simplified example: suppose a state consists of 50 voters, 20 of whom vote for a blue party and 30 for a red party. Voters might live in a grid pattern, as in, say, some sections of Manhattan. Suppose there are 10 north-south avenues and five east-west streets. All the red voters live on the first two avenues, the ones furthest west. The blue voters reside on the other three avenues. Now the task is to divide the voters into five electoral districts of equal size.
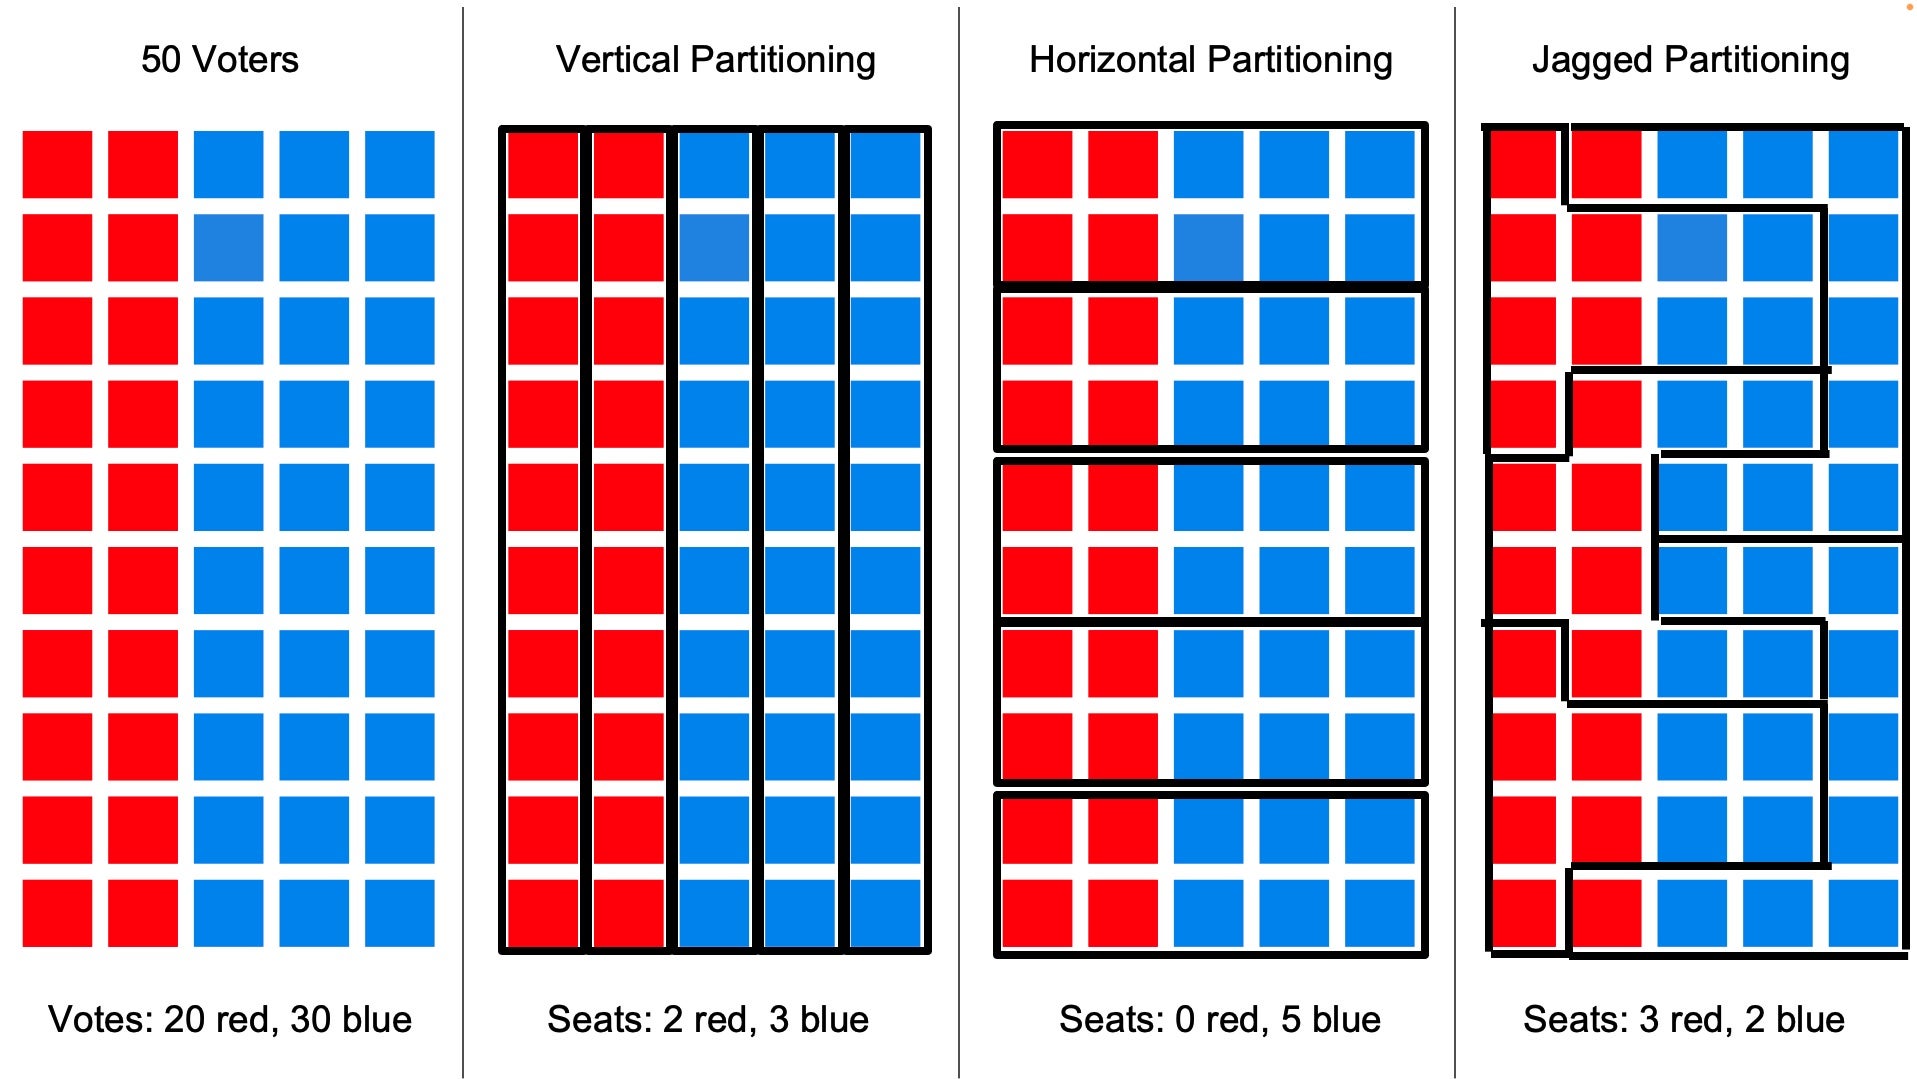
Deliberate choices about the boundaries of an electoral district can favor one party over another. Credit: Spektrum der Wissenschaft/Manon Bischoff (detail)
One could draw five vertical boundaries: Then there would be two election districts with only red voters and three with only blue voters. So the votes in that district would produce three blue party representatives and two red party ones, an accurate reflection of voters’ opinions.
But if the blue party were to get its way in drawing district boundaries, they might be inclined to draw the boundaries horizontally. Then all the districts would look the same, with four red voters and six blue voters each. In this case, the blue party wins in each district, and gets all five representatives. Something similar happened in New York state in 2012: 58 percent of people there voted for the Democrats, but the party got 21 of 27 seats (five more than would have been justified if the election districts had been drawn equitably).
State legislatures and the commissions that redraw district lines, on the other hand, might make a very different (somewhat more complicated) partitioning. To do this, they could pack almost all blue voters into two districts, giving the red party a majority in the three remaining districts in which there would be three red congressmen and two blue congresswomen—although more voters gave their votes to the blue party. There are numerous examples of this in U.S. congressional races. For example, in Pennsylvania in 2012, Democrats received 51 percent of the vote, but only five of 18 seats.
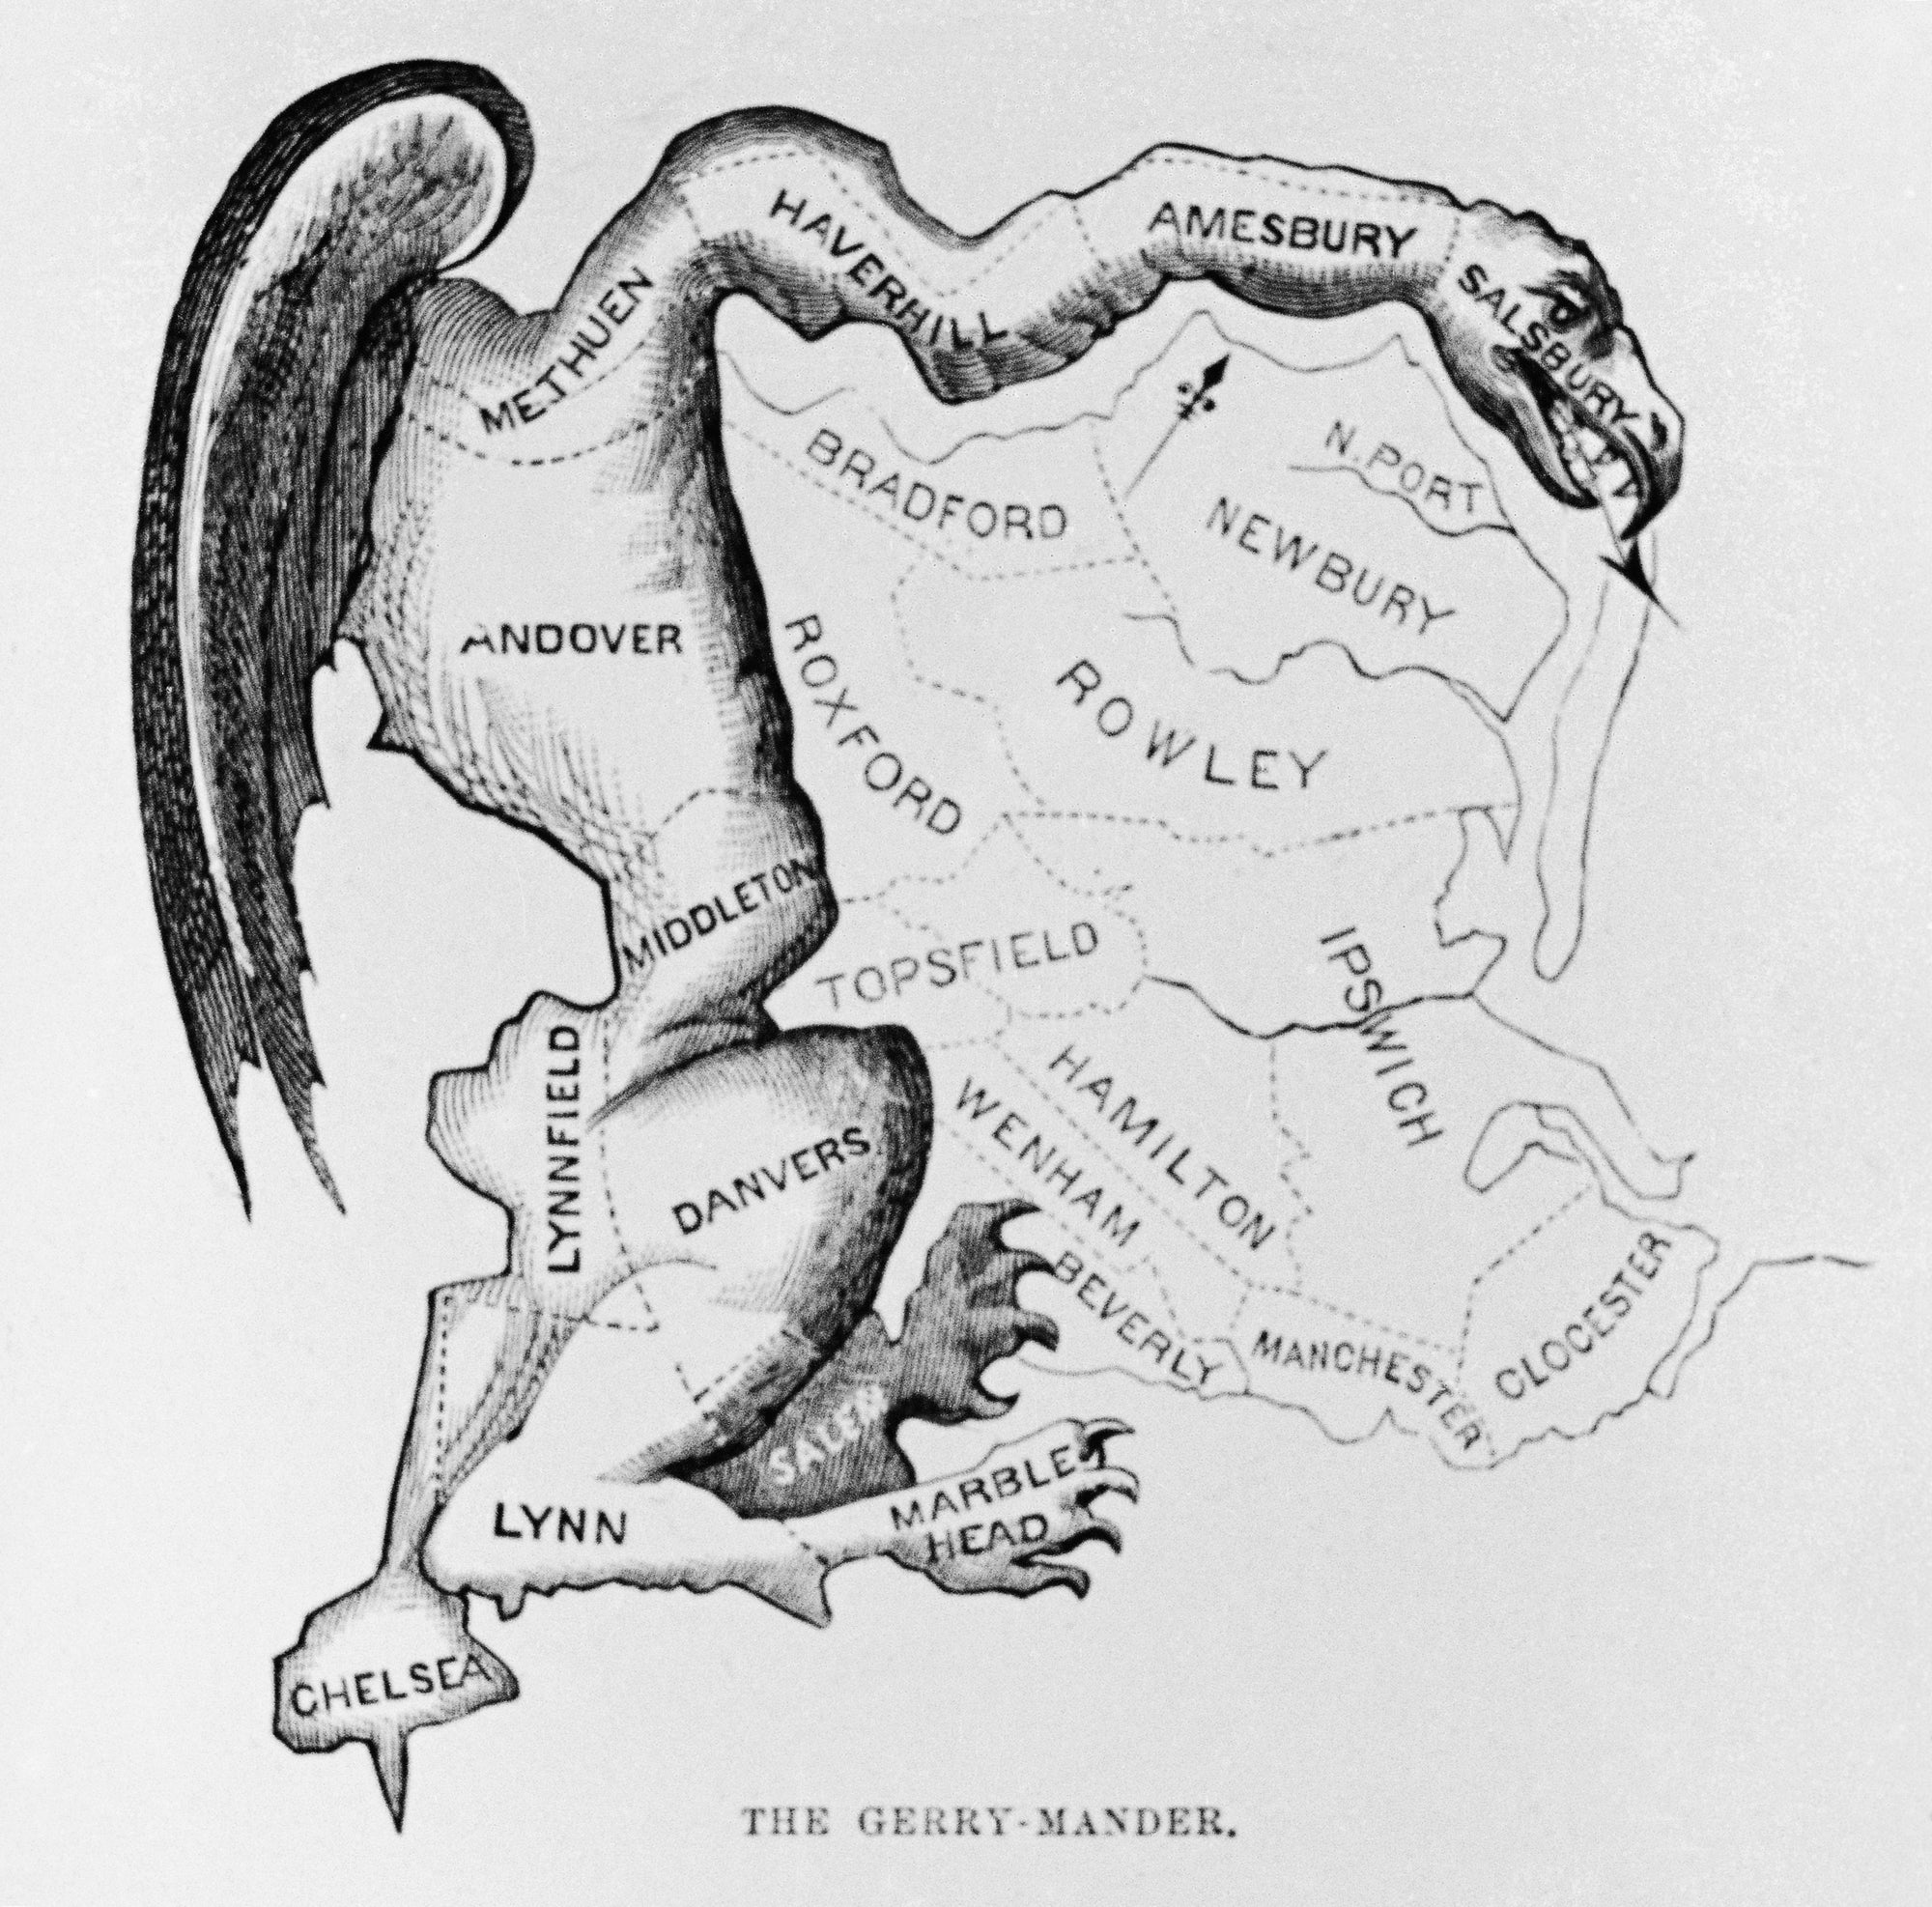
The Gerry Mander’s body conforms to the shape of a Massachusetts electoral district drawn up by Governor Elbridge Gerry in the early 19th century. It reminded cartoonist Elkanah Tisdale in 1812 of a salamander. Credit: Bettmann/Getty Images
The deliberate redrawing of districts to gain a majority goes by the name of gerrymandering, a portmanteau of “gerry” and “salamander.” The former refers to Elbridge Gerry, the governor of Massachusetts in the early 19th century, who approved extremely odd-shaped voting districts that gave his party an advantage.
Even today, in most U.S. states, legislatures decide on the division of electoral districts about every 10 years (with the appearance of the new census). Time and again, the incumbent parties are suspected of using redistricting to their advantage. This can often be seen in strange-shaped electoral districts, similar to the one in Massachusetts at the beginning of the 19th century. A cartoonist at the time noticed that one of the districts resembled a salamander and thus coined the expression gerrymandering.
Redistricting has provoked numerous legal challenges. In 1986, the U.S. Supreme Court even ruled that intentional gerrymandering is illegal. But since then, it has barely touched an election district. As it turns out, setting rules for fair districting is not so easy. Even mathematicians are racking their brains over the question—and arming themselves with enormous computer power to deal with the problem.
.jpg?w=2000)
Boundaries for Maryland’s third congressional district. Credit: GIS shapefile data created by the United States Department of the Interior/Boundaries for Maryland’s 3rd United States Federal Congressional District (since 2013)/Wikimedia (detail)
How can you find gerrymandering? Observing the Maryland district pictured above, you might suspect the designers had certain ulterior motives. What is particularly striking is that it is extremely jagged. One assertion is that district borders should be “compact”—but without defining what “compact” means exactly.
One possible clue that gerrymandering may be present is the length of the outer boundary: the more jagged a district, the larger the perimeter. The literature related to redistricting sometimes advocates drawing the smallest possible circle to include the area within a district and comparing it to the area of existing boundaries. The more the district’s borders deviate from a circle, the greater the possibility that the district has been redrawn to suit partisan ends. The average distance between residents of a precinct may also indicate gerrymandering.
The partitioning into electoral districts is anything but simple. Each state follows its own rules in doing so. The ideal goal is for a district to contain roughly equal numbers of voters, be contiguous, not discriminate against ethnic groups, not cross county lines, and follow natural boundary lines, such as rivers. Such restrictions by themselves result in fractured districts—without even considering the voting behavior of residents.
A compact voting district does not necessarily lead to equitable representation, as a 2013 study found. The study paid particular attention to the 2000 presidential election in Florida, in which about as many people voted for Democrats as Republicans, but the latter accounted for 68 percent of the votes in Florida’s congressional districts. The researchers used a nonpartisan algorithm designed to draw the most “compact” districts possible while adhering to the state’s established rules.
Surprisingly, the computer also produced skewed results, in which Republicans would mostly have an advantage. And experts quickly realized the reason: most Democrats live in Florida cities. This means they win urban districts overwhelmingly, while narrowly losing in rural areas in each case. Because of this “natural gerrymandering,” more Republicans inevitably take seats in the House of Representatives.
Florida is not an isolated case, as political scientist Jonathan A. Rodden noted. The main problem is not a district’s lack of “compactness.” If you want to prove that a boundary was deliberately drawn to give one party an advantage, you need more evidence than the mere shape of a district.The goal in an unbiased system is to find electoral districts so that each party has an equal chance of converting its votes into electoral seats. But how can we measure that? In 2014, University of Chicago legal scholar Nicholas Stephanopoulos and Public Policy Institute of California political scientist Eric McGhee developed a metric for the problem, the efficiency gap. It is calculated by subtracting the “wasted” votes of two parties from each other and then dividing by the total number of all votes. A wasted vote for any party, in this example, is one that ends up in a losing district that went to the opposite party or that is above the margin needed to win. The smaller the efficiency gap, the more impartial is the result.
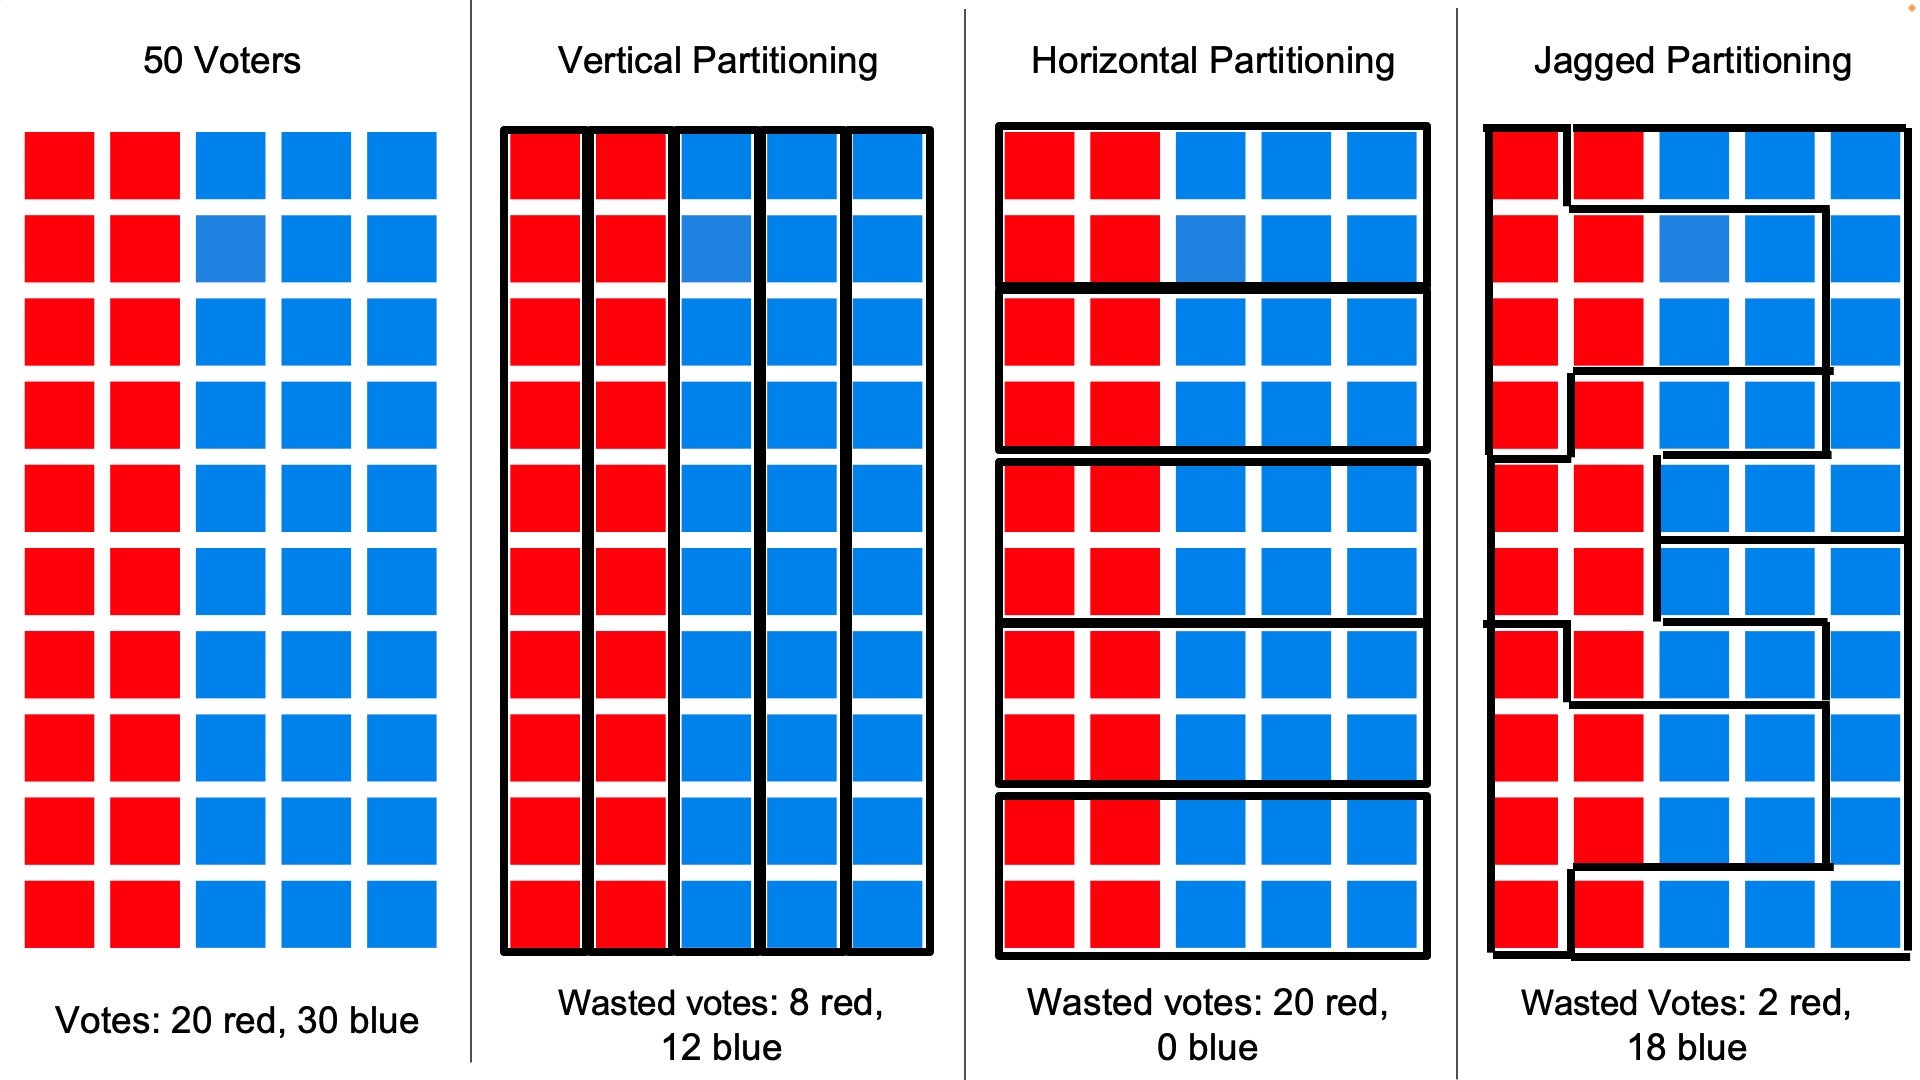
Calculating the efficiency gap, a measure of fairness in establishing electoral districts. Credit: Spektrum der Wissenschaft/Manon Bischoff (detail)
To visualize this, we can again use the initial example with the 50 voters (20 for red, 30 for blue) and calculate the efficiency gap for the different divisions. In the first case, when all boundaries were drawn vertically, the first and second districts (from the left) each have 10 red votes, wasting four each. The third, fourth and fifth districts, on the other hand, each have 10 blue votes, four of which are also wasted. Thus, the efficiency gap is as follows (the vertical bars indicate absolute value): |(2 x 4) – (3 x 4)|/50 = 2/25 = 0.08.
In the second division, each district is equal: blue always wins by six votes out of 10. Thus, none of blue’s votes are wasted—whereas all of red’s are. The efficiency gap is 20/50 = 0.4, which is significantly higher than in the first division.
The third example is the most intriguing: the two districts in which blue wins 9 to 1 each have a blue surplus of three. In the three winning red districts, four blue votes each are wasted—so in total, (2 x 3) + (3 x 4) = 18 blue votes that are surplus ones. In contrast, there are only two red votes that were wasted. This results in an efficiency gap of (18 – 2)/50 = 8/25 = 0.32.
The efficiency gap is useful as an indicator that pins down partisanship in voting districts. But sometimes natural conditions, such as when almost all voters of a party live in the same city, make it hard to find better possibilities. To investigate these possibilities, statistician Wendy Cho, along with computer scientist Yan Liu and geographer Shaowen Wang of the University of Illinois at Urbana-Champaign, designed an algorithm that divides maps into districts—based on the rules set by the state in question.
Finding the best possible division of districts so that each party has the same probability of converting a vote into a seat is extremely difficult. The task falls into the class of so-called NP problems, which computer scientists and mathematicians have suspected for decades cannot be solved efficiently with ordinary computers. That doesn’t mean you can’t find a solution—just that it may take a very, very long time. So Cho and her co-authors decided to let the computer construct an extremely large number of splits that are not necessarily perfect.
For example, when they applied their program to the state of Maryland in 2011, they realized that almost all of the 250 million results gave an advantage to Democrats. Apparently, the natural conditions, along with the requirements for voting districts, are such that Republicans are automatically at a disadvantage. Cho and her colleagues compared Maryland’s actual apportionment with the computer’s output and were able to show that the official voting districts favored Democrats in more than 99.79 percent of the 250 million computer-generated results.
Meanwhile, some U.S. states (mainly those where Democrats are in the majority) use independent commissions that redraw voting districts. These panels often resort to computer programs to find the fairest possible apportionment. In general, the apportionment of electoral districts this year appears to be the fairest in 40 years, as reported by the New York Times. When advantageous or detrimental districting decisions for both parties in all U.S. states are netted against one another, gerrymandering should result in only three extra seats for Republicans—down from 23 seats in 2012. But even three seats could be decisive in a close election. And news stories before the midterms depicted how gerrymandering is still very much a matter of public debate: Alabama’s state legislature redistricted to put many of the Black voters in the state into just one district, decreasing their electoral power, and resulting in a case that is now before the U.S. Supreme Court.